
I. Abstract
The OGC Testbed-17 Moving Features (MF) task addressed the exchange of moving object detections, shared processing of detections for correlation and analysis, and visualization of moving objects within common operational pictures. This Engineering Report (ER) explores and describes an architecture for collaborative distributed object detection and analysis of multi-source motion imagery, supported by OGC MF standards. The ER presents the proposed architecture, identifies the necessary standards, describes all developed components, reports on the results of all TIE activities, and provides a description of recommended future work items.
II. Executive Summary
Moving Features play an essential role in many application scenarios. The growing availability of digital motion imagery and advancements in machine learning technology will further accelerate widespread use and deployment of moving feature detection and analysis systems. The OGC Testbed-17 Moving Features task considers these developments by addressing exchange of moving object detections, shared processing of detections for correlation and analysis, and visualization of moving objects within common operational pictures. This OGC Moving Features (MF) Engineering Report (ER) explores and develops an architecture for collaborative distributed object detection and analysis of multi-source motion imagery. The goal is to define a powerful Application Programming Interface (API) for discovery, access, and exchange of moving features and their corresponding tracks and to exercise this API in a near real-time scenario.
An additional goal is to investigate how moving object information can be made accessible through HTML in a web browser using Web Video Map Tracks (WebVMT) as part of the ongoing Web Platform Incubator Community Group (WICG) DataCue activity at W3C. This aims to facilitate access to geotagged media online and leverage web technologies with seamless integration of timed metadata, including spatial data.
In the Testbed-17 Moving Features thread, raw data were provided from drones and stationary cameras that push raw video frames to the deep learning computer. A deep learning computer model detected moving features (school buses in the scenario employed) using a pre-trained model in each frame and then built tracklets one by one using a prediction and estimation algorithm for consecutive frames. The tracklets were then sent to the Ingestion Service. The Storage Service received and returned moving features as JSON objects. The Tracking Service employed object detection and tracking methods to extract the location of moving objects from video frames. The scope of the Machine Analytics Client component was to generate information derived from the tracklets provided by the Tracking Service developing a set of analytics. This included enriching the existing tracks by creating a more precise segmentation of the moving features detected by the Ingestion Service.
Some of the important recommendations for future work include:
-
Ingestion Service: update Ingestion service to temporarily store observations locally. This will prevent data loss if the Storage service goes offline.
-
Machine analytics client: a seasonality analysis should take as input data conditioned on the season in which they were retrieved in order to find the difference in patterns among the data based on the different seasons with the aim of identifying the effect that the time in which the data was retrieved has on the behavior and the distribution.
-
Autonomous vehicle use case: combining multi-sensor data to improve detection accuracy and cognitive guidance.
II.A. General Purpose of the MF thread and this Engineering Report
Testbed 16 demonstrated that Motion Imagery derived Video Moving Target Indicators (VMTI) can be extracted from an MPEG-2 Transport Stream file and represented as OGC Moving Features or WebVMT. The work in the Testbed-17 activity formalized an architecture for integrating moving object detections, proposed standards for the required APIs and content encodings, expanded the sources of moving object detection that can be supported, and explored exploitation and enhancement capabilities which would leverage the resulting store of moving features.
The Testbed-17 Call for Participation stated that the architecture shall include the following components:
-
Detection ingest: This component will ingest data from a moving object detection system, extract detections and partial tracks (tracklets), and export the detections and tracklets as OGC Moving Features.
-
Tracker: This component ingests detections and tracklets as OGC Moving Features, then correlates them into longer tracks. Those tracks are then exported as OGC Moving Features.
-
Data Store: Provides persistent storage of the Moving Feature tracks.
-
Machine Analytics: Software which enriches the existing tracks and/or generates derived information from the tracks.
-
Human Analytics: Software and tools to help users exploit the Motion Imagery tracks and corresponding detections or correlated tracks. For example, a common operational picture showing both static and dynamic features.
This list of components and their definitions serve as a starting point. Participants in this task were free to modify them as conditions require. This work was demonstrated using a real-time situational awareness scenario. A key objective was to experiment with both subscription models as well as data streams to trigger prompt updates in the analytics components based on Moving Feature behavior.
II.B. Deliverables and requirements of the MF set components in particular
The following figure illustrates the work items and deliverables of this Testbed-17 MF task.

Figure 1 — Moving Features task work items and deliverables. (Source: OGC Testbed-17 CFP)
Important to note is that Figure 1 shows D138 and D142, as provided in the CFP document, however, these modules were removed before the start of this testbed.
The MF Engineering Report (ER) captures the proposed architecture, identifies the necessary standards, describes all developed components, reports on the results of all TIE activities, provides an executive summary and finally a description of recommended future work items.
In summary, Testbed-17 MF addressed the following components and requirements:
-
D135 Ingestion Service — Software component that ingests data from a moving object detection system, extracts detections and partial tracks (tracklets), and exports the detections and tracklets as OGC Moving Features to the Storage Service via an interface conforming to OGC API — Moving Features. The component provider shall make the data set available that has been used for object detection to other participants in this task. If no source data is found for the final use cases, OGC and sponsors will help finding appropriate video material. The component can be implemented as a microservice or client.
-
D136 Ingestion Service — component similar to D135.
-
D137 Tracking Service — Service component that correlates detections and tracklets into longer tracks. Those tracks are then exported as OGC Moving Features to the Storage Service via an interface conforming to the draft OGC API — Moving Features specification. In addition, the service shall expose the interface conforming to OGC API — Moving Features to allow other software components to discover and access tracks directly. The Tracking Service can work on its own detection system, but shall access detections and tracklets from the Storage Service. Ideally, the service supports subscriptions.
-
D139 Machine Analytics Client — Client component that provides OGC Moving Feature analytics and annotation. The client shall enrich existing tracks and/or generate derived information from the tracks. The software shall demonstrate the value added of multi-source track data. Enriched OGC Moving Features shall be stored in the Storage Service. In contrast to the Client D140, this client focuses on the analytics. It accesses external or uses internally available additional data sources, e.g. road and hiking path network data, to annotate detected moving objects in the scenarios.
-
D140 — Human Analytics Client — Client software and tools to help users exploit the multisource track data. For example, a common operational picture showing both static and dynamic features. In contrast to the Machine Analytics Client, focus is here on graphical representation of OGC Moving Features, detected and annotated from multiple source systems, in a common operational picture.
-
D141 Storage Service — Service component that stores OGC Moving Features. The service exposes the interface conforming to OGC API — Moving Features to discover, access, and upload OGC Moving Feature resources. The storage service shall have the potential to serve tracks in near real time.
The figure below shows in diagram form the architecture linking the different components of the Moving Features (MF) task.

Figure 2 — Testbed-17 Moving Features preliminary architecture workflow. (Source: OGC Testbed-17 MF participants)
III. Keywords
The following are keywords to be used by search engines and document catalogues.
ogcdoc, OGC document, Moving Features
IV. Preface
Attention is drawn to the possibility that some of the elements of this document may be the subject of patent rights. The Open Geospatial Consortium shall not be held responsible for identifying any or all such patent rights.
Recipients of this document are requested to submit, with their comments, notification of any relevant patent claims or other intellectual property rights of which they may be aware that might be infringed by any implementation of the standard set forth in this document, and to provide supporting documentation.
V. Security considerations
No security considerations have been made for this document.
VI. Submitting Organizations
The following organizations submitted this Document to the Open Geospatial Consortium (OGC):
- RSS-Hydro Sarl
VII. Submitters
All questions regarding this document should be directed to the editor or the contributors:
| Name | Organization | Role |
|---|---|---|
| Guy Schumann | RSS Hydro | Editor |
| Alex Robin | Botts Innovative Research | Contributor |
| Martin Desruisseaux | GEOMATYS | Contributor |
| Andrea Cavallini | RHEA Group | Contributor |
| Rob Smith | Away Team | Contributor |
| Dean Younge | Compusult | Contributor |
| Sepehr Honarparvar | University of Calgary | Contributor |
| Steve Liang | University of Calgary | Contributor |
| Sizhe Wang | ASU | Contributor |
| Chuck Heazel | Heazel Technologies | Contributor |
| Brad Miller | Compusult | Contributor |
OGC Testbed-17: Moving Features ER
1. Scope
This ER represents deliverable D020 of the OGC Testbed-17 Moving Features task. A ‘feature’ is defined as an abstraction of real world phenomena [ISO 19109:2015] whereas a “moving feature” is defined as a representation, using a local origin and local ordinate vectors, of a geometric object at a given reference time [adapted from ISO 19141:2008]. In the context of this ER, the geometric object represents a feature.
This ER aims to demonstrate the business value of moving features that play an essential role in many application scenarios.
The value of this Engineering Report is to improve interoperability, advance location-based technologies and help realize innovations in the context of moving features.
Note that this ER (OGC 21-036) is a stand-alone document and there is thus some considerable overlap with the T17 D021 OGC API Moving Features ER (OGC 21-028).
1.1. Terms and definitions
Moving feature
-
A representation, using a local origin and local ordinate vectors, of a geometric object at a given reference time (ISO 19141:2008). In the context of this ER, the geometric object is a feature, which is an abstraction of real world phenomena (ISO 19109:2015).
Tracking
-
Monitoring and reporting the location of a moving object (adapted from ISO 19133:2005).
Tracklet
-
A fragment of the track followed by a moving object.
Trajectory
-
Path of a moving point described by a one parameter set of points (ISO 19141:2008).
Trajectory mining
-
The study of the trajectories of moving objects in order to find interesting characteristics, detect anomalies and discover spatial and spatiotemporal patterns among them.
1.2. Abbreviated terms
API
-
Application Programming Interface
MF
-
Moving Feature(s)
MISB
-
Motion Imagery Standards Board
ML
-
Machine Learning
MPEG
-
Moving Picture Experts Group
MSE
-
Mean Squared Error
VMTI
-
Video Moving Target Indicator
WebVMT
-
Web Video Map Tracks
WICG
-
Web Platform Incubator Community Group
WMS
-
Web Map Service
W3C
-
World Wide Web Consortium
2. Overview
This engineering report represents deliverable D016 of the OGC Testbed 17 performed under the OGC Innovation Program.
Chapter 1 introduces the scope of the subject matter of this Testbed 17 OGC Engineering Report.
Chapter 2 provides an executive summary of the Testbed-17 MF activity.
Chapter 3 provides a short overview description of each chapter (this chapter).
Chapter 4 provides a short introduction to the Testbed-17 MF activity.
Chapter 5 provides an overview of the requirements and scenario.
Chapter 6 illustrates the flow of work items.
Chapters 7 to 13 contain the main technical details and work activity description of this ER. This section provides a high-level outline of the use cases, followed by an in-depth description of the work performed and the challenges encountered, raising issues and discussing possible solutions.
Chapter 14 summarizes the MF TIE tracking.
Chapter 15 summarizes recommendations and suggests top-priority items for future work.
Annex A includes an informative revision history table of changes made to this document.
Bibliography
3. Introduction
The following are the topics identified during the recent OGC testbeds that were evaluated and described in the Testbed-17 initiative:
There are a number of ways that systems detect and report on moving objects. These systems exist in “stovepipes of excellence”. As a result, users of these systems do not have access to information generated through other means. The ability to combine multiple sources of moving object data would greatly improve the quality of the data and the analytics which could be applied.
The overall aim is to identify an architecture framework and corresponding standards which will allow multiple sources of moving object detections to be integrated into a common analytic environment.
In this context, Testbed 16 explored technologies to transform detections of moving objects reported using motion imagery standards (e.g. MISB Std. 0903) into the model and encoding defined in the OGC Moving Features Standard (OGC 18-075). That work suggests a notional workflow:
-
Extract moving object detections from the motion imagery stream
-
Encode the detections as moving features
-
Correlate the detection of moving features into track moving features
-
Perform analytics to enrich and exploit the tracks of moving features
This work is documented in the Testbed-16 Full Motion Video to Moving Features Engineering Report (OGC 20-036).
The OGC Moving Features Standards Working Group (SWG) has added a new work activity for defining an OGC-MF API. The participants watched this process closely to ensure both activities are aligned properly. In any case, Testbed-17 participants worked closely with the SWG and coordinated all efforts.
4. Requirements, Scenarios and Architecture
This chapter identifies the requirements and lays out the architecture framework as well as the scenario.
4.1. Requirements
Testbed 16 demonstrated that Motion Imagery derived Video Moving Target Indicators (VMTI) can be extracted from an MPEG-2 motion imagery stream and represented as OGC Moving Features or Web Video Map Tracks (WebVMT).
The work performed in the TB-17 MF task formalized an architecture for integrating moving object detections, proposed standards for the required APIs and content encodings, expanded the sources of moving object detection that can be supported, and explored exploitation and enhancement capabilities which would leverage the resulting store of moving features.
The architecture includes the following components :
-
Detection ingest: This component will ingest data from a moving object detection system, extract detections and partial tracks (tracklets), and export the detections and tracklets as OGC Moving Features.
-
Tracker: This component ingests detections and tracklets as OGC Moving Features, then correlates them into longer tracks. Those tracks are then exported as OGC Moving Features
-
Data Store: provides persistent storage of the Moving Feature tracks.
-
Machine Analytics: software which enriches the existing tracks and/or generates derived information from the tracks
-
Human Analytics: software and tools to help users exploit the Motion Imagery tracks and corresponding detections or correlated tracks. For example, a common operational picture showing both static and dynamic features.
This work was demonstrated using a real-time situational awareness scenario.
4.2. Scenario use case
This ER describes the detection and tracking of moving buses in front of a school. The video was acquired by a light-weight Unmanned Aerial Vehicle (UAV) or drone, courtesy of University of Calgary.
A separate autonomous vehicle use case was analyzed to detect and track people and vehicles moving nearby with WebVMT. Video and lidar data were captured from a moving StreetDrone vehicle and provided courtesy of Ordnance Survey UK.
5. Flow of work items
The diagram below is meant to describe the flow from start to finish and it includes all modules covered in Testbed-17.

Figure 3 — Flow of modules. (Source: Testbed-17 MF participants)
6. Ingestion Service (University of Calgary)
6.1. Introduction
The Ingestion service receives raw data from sensors or edge computers and converts it into Observations (See SensorThing’s specification for details). The service then posts these observations to the Storage service where it is interpreted and stored as Features (See Feature specification for details). There are three components to an Ingestion service; the receiver, the convertor and the sender. The receiver reads in the raw data. The convertor parses the data and turns it into SensorThing’s Observations. Finally, the sender component publishes the Observations to the Storage service via the MQTT protocol.
6.2. Ingestion process architecture
As the developed ingestion service ingests tracklets from detected objects in video frames, the following architecture was designed to handle the ingestion tasks.

Figure 4 — Ingestion process architecture
In Testbed-17, raw data providers were drones and stationary cameras that push raw video frames to the deep learning computer. The deep learning computer detects moving features (buses) using a pre-trained model in each frame and then builds tracklets one by one using a prediction and estimation algorithm for consecutive frames. The result of this procedure is the object bounding box (bbox), class, track_id, color, and the detection time. Then these tracklets are sent to the ingestion service using http POST. The ingestion service was implemented on an AWS EC2 service with Ubuntu server x64 OS. The flask web framework Nginx, was used as the web server, and Guncorn used as the web server gateway to handle the ingestion service. The EC2 service takes the data in the format that is mentioned in the Input section . Ingestion service includes a camera registration module which lets users register cameras with their metadata in the ingestion service. To register a camera, a route in the service based on the following format was created:
http://52.26.17.1:5000/register_cam
To register a camera the following payload should be posted.
{
"id":"name of the camera",
"cam_location":[longitude,latitude],
"image_coords":[[x0, y0], [x1, y1], [x2, y2],...,[xn, yn]],
"ground_coords":[[longitude0, latitude0],
[longitude1, latitude1],
[longitude2, latitude2],
[longitude3, latitude3],...,[longitude_n, latitude_n]]
}
The camera metadata is stored in a MongoDB (nosql) database which can be used for transformation of image coordinates to geographic coordinates. Also, the ingestion service uses this data to let the storage service know what the source of the observations is. Based on the Testbed-17 Moving Feature architecture, cameras are registered as Things in the SensorThings API (STA) model. The names of Thing instances are used to let other services, such as machine analytics, access the raw or process video streams.
After the camera registration in the ingestion service, tracklets are posted to the relevant camera route in the ingestion service. To do so, the following route should be used.
http://52.26.17.1:5000/ingestion/Camera_name
The payload input format of this POST request is mentioned in the Input section.
NOTE As the other ingestion service does not have a direct access to the tracklet results, the developed ingestion service provides the transformed tracklets to the other ingestion service.
After receiving the tracklets from the deep learning computer, based on the camera that records the video, coordinates are transformed into longitude and latitude . For the transformation, image and the corresponding ground control points were employed. The details are explained in the Transformation section.
Finally, tracklets are enriched with the geographic coordinates and are published in the STA observation format (which is discussed in the Output section) in MQTT payloads. The storage service endpoint details for receiving the tracklets from ingestion services is:
{
"broker": "tb17.geomatys.com",
"port": 30170,
"topic": "/Observations",
"Datastream": 1
}
6.3. Transformation
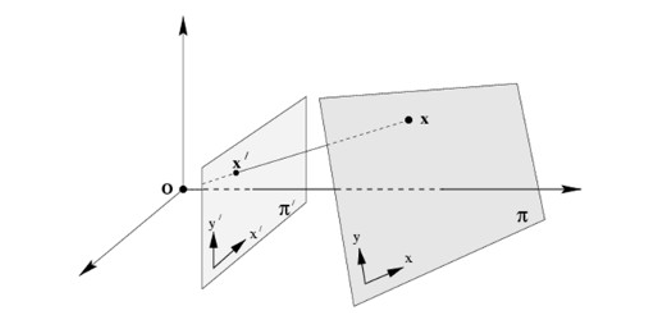
The final task was to transform objects’ locations from the video space into geographic space. To do so, a homomorphic model which is similar to 2D projective transformation, was used. Homography includes 8 main variables in a 3×3 transformation matrix. So, to resolve the transformation, at least 4 GCP (Ground Control Point) are required. This approach is widely used for transforming objects from one planar space to another planar space. [3] In the following Figure, one of the plains can be considered as the image frame and the other one would be the ground plane in the geography space.

Figure 5 — Homography transformation (source: http://man.hubwiz.com)
6.4. Input
Sensors should push tracklets data into the ingestion service while the tracklet payload must have bbox, time, and trackid as attributes. Also, the ingestion service can process bbox and color of objects as optional attributes. The input format of the ingestion service:
{
"class":"bus",
"track_id":23,
"bbox":[23,12,34,51],
"time":"2021-05-13T00:09:18Z",
"color":[255,255,0]
}
definitions:
class: The moving object type which can be car, bus, bicycle, person, …
track_id: The unique id of the tracked moving object
bbox: Bounding box of objects in the camera coordinate system. [upper-left x, upper-left y, width, height]
time: The phenomenon time or the time that object has been detected on video frames
color: The mean RGB color code of the detected object
6.5. Functions
The ingestion service uses a NoSQL database to register cameras. They are stored in the camera table as json objects. These objects include coordinates transformation parameters as well as camera metadata. This information is used in the conversion part of the ingestion service when image coordinates are received by the ingestion service. The output of this conversion is the geographic coordinate of the moving object. The following shows the payload for registering cameras in the ingestion service.
{
"id":"GoProTestbed17",
"cam_location":[ -114.16064143180847, 51.085716521902036],
"image_coords":[[629, 881], [1201, 695], [855, 604],[1808, 572]],
"ground_coords":[[-114.160505, 51.085698],
[-114.160515, 51.085604],
[-114.160166, 51.085476],
[-114.160769, 51.085106]]
}
After points transformation, the STA function converts the received data to the STA format and sends it to the storage service endpoint in MQTT format. The following shows an example of the output of the ingestion service to the storage service.
{
"phenomenonTime": "2021-07-27T04:03:03Z",
"resultTime": "2021-07-27T04:03:03Z",
"result": 48,
"FeaturesOfInterest": {
"name": "48,-114.16081989038098,51.085107555986895",
"description": "BusMovingObject",
"encodingType": "application/vnd.geo+json",
"feature": {
"type": "Feature",
"properties": {
"image_bbox": [
944,
765,
123,
59
],
"image_color": [
42,
38,
41
],
"class": "bus"
},
"geometry": {
"type": "Point",
"coordinates": [
-114.16081989038098,
51.085107555986895
]
}
}
},
"Datastream": {
"@iot.id": 60987
}
}
The other module is the Compusult Component which feeds the D135 ingestion service.
6.6. Data
To show the capabilities of the ingestion service, two videos were recorded from two different points of views. One of them was recorded from a drone’s point of view and the other one was recorded from a fixed GoPro camera. The first camera points to the bus station and the second camera points to the street which ends at the bus station. Using the methods which has been described in the next chapter, objects are detected and tracked. Then the detected objects are sent to the ingestion service, as soon as they are observed in a frame, using the HTTP POST method. Figure 1 illustrates a frame of detected objects by GoPro camera and Figure 2 shows a snapshot of a bus station recorded by the drone. These two videos are almost synced.

Figure 6 — Drone raw video

Figure 7 — Drone raw video
6.7. Demonstration video
A demonstration video of the implemented ingestion service for the bus scenario has been provided at https://www.youtube.com/watch?v=79Sb8zbenKo.
7. Ingestion Service (Compusult)
7.1. University of Calgary Data In
The Compusult Ingestion service will accept input from the University of Calgary. This input is a result of an Object detection algorithm written by the University of Calgary team. Each HTTP POST to Compusult includes JSON formatted data in the body of the request. This JSON object includes all the data necessary to locate the particular tracked object at the given time as well as the data required to do post processing on the video and/or object in question.
Example University of Calgary JSON request body:
{
"thing_name":"UofC Drone Camera Test 3",
"class":"bus",
"track_id":188111,
"bbox":[23,12,34,51],
"time":"2020-05-13T00:02:38Z",
"color":[255,255,0],
"coordinates": [-114.16091476887192, 51.10611218022975],
"Deployment Condition": "Deployed on a drone",
"Case Used": "Testbed17",
"Raw video URL": "https://drive.google.com/file/d/1uVrOWpmG-UiPh-4IM8A9LInoTfmjouNl/view?usp=sharing",
"Transformation Parameters": {
"GCP":[
[-114.161616, 51.084940],
[-114.161780, 51.084679],
[-114.160671, 51.084689],
[-114.160777, 51.085036]
],
"IMC":[
[1856, 747],
[1770, 660],
[823, 667],
[935, 788]
]
}
}
7.2. SensorThings Data Out
This Ingestion service converts the JSON data provided by the University of Calgary to a SensorThings Observation JSON object. The service then checks its local database table to see if it has encountered this Thing (identified by thing_name) before. If it has not, an HTTP Post request is made to the Storage Service to see if the Thing exists there. If it does, an entry for it is added to the local database table and it continues, if the Thing does not exist in the Storage Service then the Ingestion service will initialize it (i.e., create the Thing and Datastream) using the SensorThings API hosted by the Storage Service. A sample request and response is shown below.
Request URL
https://tb17.geomatys.com/API/STA/Things
Request Body
{
"name": "DroneDIJ5433_Test1",
"description": "The camera for the monitoring school bus from a drone.",
"properties": {
"Deployment Condition": "Deployed on a drone",
"Case Used": "Testbed17",
"Raw video URL": "https://drive.google.com/file/d/1uVrOWpmG-UiPh-4IM8A9LInoTfmjouNl/view?usp=sharing",
"Transformation Parameters": {
"GCP":[
[-114.161616, 51.084940],
[-114.161780, 51.084679],
[-114.160671, 51.084689],
[-114.160777, 51.085036]
],
"IMC":[
[1856, 747],
[1770, 660],
[823, 667],
[935, 788]
]
}
},
"Datastreams": [{
"description": "Detected objects of the Drone video streams"
}]
}
Once the Ingestion service has confirmed that the Storage Service has the required Thing and Datastream it makes a connection to the MQTT Broker hosted by the Storage Service and begins publishing the Observations via MQTT. A sample JSON object representing one of these Observation payloads is shown below.
MQTT Payload
{
"result": 1299967,
"resultTime": "2000-05-16T00:02:22Z",
"Datastream": {
"@iot.id": 52
},
"FeatureOfInterest": {
"feature": {
"geometry": {
"coordinates": [
-117.16091476887192,
55.10611218022975
],
"type": "Point"
},
"type": "Feature",
"properties": {
"image_color": [
255,
255,
0
],
"image_bbox": [
23,
12,
34,
51
]
}
},
"encodingType": "application/vnd.geo+json",
"name": "Object Location",
"description": "The current location of the object being tracked."
},
"phenomenonTime": "2000-05-16T00:02:22Z"
}
Note: This can be done via the SensorThings API hosted by the Storage Service. As shown above this Ingestion service implementation handles the creation of the Thing and Datastream if necessary. It is a one-time operation for the given Bus scenario.
7.3. Initialize (via HTTP) and Publish (via MQTT)
The following sequence describes the communication that has to happen initially between the Ingestion service and the Storage Service before the Ingestion service can begin to publish SensorThings Observations.
1) Get request to SensorThings web API. This request is used to determine if the Thing exists or not.
Example Request
https://tb17.geomatys.com/API/STA/Things
2) POST request to SensorThings web API to create the Thing and Datastream.
Example Request
URL
https://tb17.geomatys.com/API/STA/Things
Body
{
"name": "Camera Object Detected",
"description": "The camera for the monitoring school bus from a drone.",
"properties": {
"Deployment Condition": "Deployed on a drone",
"Case Used": "Testbed17",
"Raw video URL": "https://drive.google.com/file/d/1uVrOWpmG-UiPh-4IM8A9LInoTfmjouNl/view?usp=sharing",
"Transformation Parameters": {
"GCP":[
[-114.161616, 51.084940],
[-114.161780, 51.084679],
[-114.160671, 51.084689],
[-114.160777, 51.085036]
],
"IMC":[
[1856, 747],
[1770, 660],
[823, 667],
[935, 788]
]
}
},
"Datastreams": [{
"description": "Detected objects of the Drone video streams"
}]
}
Example Response
{
"name": "Camera Object Detected",
"description": "The camera for the monitoring school bus from a drone.",
"@iot.id": "2",
"@iot.selfLink": "http://tb17.geomatys.com/API/STA/Things(2)",
"properties": {
"Deployment Condition": "Deployed on a drone",
"Case Used": "Testbed17",
"Raw video URL": "https://drive.google.com/file/d/1uVrOWpmG-UiPh-4IM8A9LInoTfmjouNl/view?usp=sharing",
"Transformation Parameters": {
"GCP":[
[-114.161616, 51.084940],
[-114.161780, 51.084679],
[-114.160671, 51.084689],
[-114.160777, 51.085036]
],
"IMC":[
[1856, 747],
[1770, 660],
[823, 667],
[935, 788]
]
}
},
"Datastreams": [
{
"description": "Detected objects of the Drone video streams",
"@iot.id": "2"
}
]
}
3) Publish SensorThings Observation JSON to the Storage Service MQTT Broker under topic ‘Datastreams(<Datastream ID returned from 2 above>)/Observations’
Example Topic
Datastreams(2)/Observations
Example Payload
{
"result": 1299967,
"resultTime": "2000-05-16T00:02:22Z",
"Datastream": {
"@iot.id": <Datastream ID returned from 2 above>
},
"FeatureOfInterest": {
"feature": {
"geometry": {
"coordinates": [
-117.16091476887192,
55.10611218022975
],
"type": "Point"
},
"type": "Feature",
"properties": {
"image_color": [
255,
255,
0
],
"image_bbox": [
23,
12,
34,
51
]
}
},
"encodingType": "application/vnd.geo+json",
"name": "Object Location",
"description": "The current location of the object being tracked."
},
"phenomenonTime": "2000-05-16T00:02:22Z"
}
8. Object detection and tracking method
8.1. Objective
The purpose of this section is to provide a general overview of the employed object detection and tracking methods to extract the location of moving objects from video frames. Due to the lack of an adequate dataset for use in this Testbed-17 activity, the University of Calgary provided datasets from two different sources (a Drone and a GoPro camera). The following is a summary of how the raw video frames to deliver real-time moving object data were processed.
8.2. Object detection
The first step in extracting moving objects from video frames is object detection. To detect an object, a regression-based object detection architecture was proposed as they provide fast detection models and generate real-time observations. YOLO (You Only Look Once) is an architecture that accomplishes detection and classification in a one-step process. To do so, the image is divided into grid cells. Every grid cell has a confidence score. The confidence score is a function of IOU (Intersect Over Union ) which determines overlapping of the predicting bbox (bounding box) over the ground truth bounding box. The latter is what is measured for the target variable for the training and testing examples. At the same time, the bbox is predicted. The loss function of YOLO, is used to correct the bbox center by the objective of increasing emphasis on boxes and decreasing emphasis on no objects [1]. The YOLO model neural network architecture contains 24 layers and 2 fully connected layers while YOLOv3 includes total of 106 layers. For this work, a pre-trained CoCo dataset model was used that included many moving objects such as cars, trucks, buses, persons, boats, etc.

Figure 8 — Yolo object detection process (Source: https://www.section.io/engineering-education/introduction-to-yolo-algorithm-for-object-detection/how-yolo-algorithm-works.jpg)
8.3. Object tracking
To monitor moving objects, vehicles are tracked between consecutive image frames. The entire procedure is divided into detecting and tracking steps. In the first step, objects of every frame are detected using the YOLO model. The second step is identifying objects in each frame and tracking them in consecutive frames. As the second part devours most of the processing unit capacity, a Simple Online and Real(time) Tracking (SORT) algorithm was used. SORT algorithm is a combination of object detection, the Hungarian algorithm (https://en.wikipedia.org/wiki/Hungarian_algorithm), and Kalman Filtering (https://en.wikipedia.org/wiki/Kalman_filter). This approach assigns an ID to each object as a unique tracking id. Having an error in object detection or the SORT tracker generates a new tracking id for objects. The following overview is based on the approach described by Bewley et al. [2]. The approach estimates the displacements of each object with a linear Kalman Filter constant velocity model. When an object is detected, a Kalman Filter uses the bbox locations to update the state of targeted objects in frames. If no detection is associated with the target, its state is simply predicted without correction using the linear velocity model. In assigning detections to existing targets, each target’s bounding box geometry is estimated by predicting its new location in the current frame. The assignment cost matrix is then computed as the intersection-over-union (IOU) distance between each detection and all predicted bounding boxes from the existing targets. The assignment is solved optimally using the Hungarian algorithm. Having new objects in the frame, a new unique ID is assigned to the object while the ID of the objects which are exited from the frame cannot be assigned again to new objects. To create trackers the IOU is calculated for every detected object and it is checked if it is less than the threshold value for the predefined IOU. The initial values for tracker speed are set to zero and a bounding box of the detected object for the first frame is the initial value for the geometry. Tracks which are not observed in the TLast frames would be deleted. This prevents an unbounded growth in the number of trackers and localization errors caused by predictions over long durations without corrections from the detector [2]. In this project, the Darknet (https://pjreddie.com/darknet/) Kalman Filtering was used for the prediction and estimation of moving objects in frames.
8.4. Transformation
The final task is to transform objects’ locations from the video space to geographic space. To do so, we used a homomorphic model which is similar to 2D projective transformation. Homography includes 8 main variables in a 3×3 transformation matrix. So, to resolve the transformation, at least 4 GCP (Ground Control Point) are required. Homography has been widely used for transforming objects from one planar space to another planar space [3].

NOTE In this project, due to the lack of access to camera EXIF files, it was not possible to consider camera parameters for the direct transformation. Therefore, this method is basically applicable for the case that we have fixed camera.
Figure 9 — Homography (Source: https://miro.medium.com/max/665/1*aAuYXY1rdkAu7afYxygF3A.png)
{
"class":"bus",
"track_id":23,
"bbox":[23,12,34,51],
"time":"2021-05-13T00:09:18Z",
"color":[255,255,0],
"coordinates": [-114.16091476887192,51.08611218022975]
}
class: The moving object type which can be car, bus, bicycle, person, …
track_id: The unique id of the tracked moving object
bbox: Bounding box of objects in the camera coordinate system. [upper-left x, upper-left y, width, height]
time: The phenomenon time or the time that object has been detected on video frames
color: The mean RGB color code of the detected object
coordinates: The geographical coordinates of the moving objects
8.5. Sample results
Processed metadata results:
GoPro camera sample results Drone camera sample results
Processed sample video result:
https://drive.google.com/file/d/1uVrOWpmG-UiPh-4IM8A9LInoTfmjouNl/view?usp=sharing
9. Tracking service
This section provides a summary of the Tracking Service functionalities, input, and output.
The tracking service has three main components for the entire workflow:
-
The tracking service gets observations of partial tracks (also called “tracklets”) from the Storage Service;
-
The tracking service links short tracklets into long tracks via the tracking algorithm;
-
The tracking service adds the long tracks to the storage service via MQTT.
Below are the details about these three components:
9.1. Get Observations/Tracklets
9.1.1. Input
The tracking service sends a HTTP request to get observations/tracklets that the Storage Service produced.
HTTP Request: https://tb17.geomatys.com/API/feature/collections/Tracklet/items
9.1.2. Response
[{'type': 'Feature',
'id': 23,
'geometry': {'type': 'Point', 'coordinates': [-114.1609, 51.0861]},
'properties': {'track_id': 23,
'class': 'bus',
'time': '2021-05-13T00:09:19Z',
'color': [255, 255, 0]}},
{'type': 'Feature',
'id': 24,
'geometry': {'type': 'Point', 'coordinates': [-114.1609, 51.0861]},
'properties': {'track_id': 24,
'class': 'bus',
'time': '2021-05-13T00:09:19Z',
'color': [255, 255, 0]}}]
9.2. Tracking Algorithm
After fetching the observations/tracklets, the tracking service takes these raw tracklets as the input and executes the tracking algorithm to link short tracklets into long tracks.
9.2.1. Input
The input of the tracking algorithm is the observations/tracklets that were retrieved via the aforementioned HTTP request.
[{'type': 'Feature',
'id': 23,
'geometry': {'type': 'Point', 'coordinates': [-114.1609, 51.0861]},
'properties': {'track_id': 23,
'class': 'bus',
'time': '2021-05-13T00:09:19Z',
'color': [255, 255, 0]}},
{'type': 'Feature',
'id': 24,
'geometry': {'type': 'Point', 'coordinates': [-114.1609, 51.0861]},
'properties': {'track_id': 24,
'class': 'bus',
'time': '2021-05-13T00:09:19Z',
'color': [255, 255, 0]}}]
9.2.2. Output
After running the tracking algorithm, the outputs are arrays of tracks. Each track is composed of an array of multiple tracklets.
output of the https://tb17.geomatys.com/API/feature/collections/Observation/items will return Observations with ‘id’ unique for each and traclet_id shared among tracklet:
{'type': 'Observation',
'id': 123,
'geometry': {'type': 'Point', 'coordinates': [-114.1609, 51.0861]},
'properties': {'tracklet_id': 23,
'class': 'bus',
'time': '2021-05-13T00:09:19Z',
'color': [255, 255, 0]}},
{'type': 'Observation',
'id': 124,
'geometry': {'type': 'Point', 'coordinates': [-116.1609, 52.0861]},
'properties': {'tracklet_id': 23,
'class': 'bus',
'time': '2021-05-13T00:09:20Z',
'color': [255, 255, 0]}},
{'type': 'Observation',
'id': 125,
'geometry': {'type': 'Point', 'coordinates': [-116.1610, 52.0862]},
'properties': {'tracklet_id': 24,
'class': 'bus',
'time': '2021-05-13T00:09:21Z',
'color': [255, 255, 0]}}
]
Tracking service will send collection of tracklet_id without other properties. Storage service internal logo will join and treat as joint tracks. In the /Tracks API, final (joint) track will be returned.
[{'track_id': '185',
'tracklet_ids': [ 23, 24]}
]
In the output result, each element in the array is a track. For each track, it has two attributes:
-
“id” is the unique identifier of the current track;
-
“tracklets”` is the observations/tracklets that the current track consists of. Each element in the “tracklets” attribute is one tracklet with the consistent format that the Ingestion Service provided.
9.3. Publish Tracks to the Storage Service via MQTT
9.3.1. Get the Datastream ID
Sends the post request to the link (https://tb17.geomatys.com/API/STA/Things) and gets the new datastream.
Post:
{
"name": "thing test",
"description": " description du things test",
"Datastreams": [{
"description": " description du datastream test"
}]
}
Response:
{'name': 'thing test',
'description': 'description du things test',
'@iot.id': '15',
'@iot.selflink': 'http://tb17.geomatys.com/API/STA/Things(15)',
'Datastreams': [{
'description': 'description du datastream test',
'@iot.id': '15'
}]}
9.3.2. Payload
The payload for publishing tracks processed by the tracking algorithm is just the output of the tracking algorithm mentioned in the previous section. The information is provided again for making the description clearer.
It is necessary for the storage service to define the payload format combined with the randomly generated Datastream ID so that the tracks from the tracking service can be published successfully to the storage service.
[{'id': '185',
'tracklets': [
{'type': 'Feature',
'geometry': {
'coordinates': [-114.16112323505082, 51.085106272931064],
'type': 'Point'},
'properties': {
'class': 'bus',
'time': '2021-05-27T04:05:41Z',
'track_id': '158',
'bbox': [1335, 769, 129, 60],
'color': [14, 9, 12],
'coordinates': [-114.16112323505082, 51.085106272931064],
'name': '158'}
]
}]
9.3.3. Connect to the MQTT Broker
hostName = "tb17.geomatys.com"
port = 30170
clientId = "tb17-client"
topic = '/tracklet/' ---> needs a new topic here for adding tracks to the server.
client = mqtt.Client(clientId) (here, the default transport is "tcp", protocol is "MQTTv311" by default)
client.connect("tb17.geomatys.com", port=30170)
client.publish(topic, payload, qos=1)
10. Machine Analytics Client
10.1. Description
The scope of the Machine Analytics Client component is to generate information derived from the tracklets provided by the Tracking Service developing a set of analytics. This includes enriching the existing tracks by creating a more precise segmentation of the moving features detected by the Ingestion Service.
The Machine Analytics Client makes use of Artificial Learning concepts, specifically from Deep Learning and Machine Learning in order to perform the defined analytics, utilizing neural networks and data mining techniques, specifically trajectory mining techniques. Trajectory mining refers to the study of the trajectories of moving objects in order to find interesting characteristics, detect anomalies and discover spatial and spatiotemporal patterns among them.
10.2. Workflow and interfaces
The Machine Analytics client directly interacts with the Storage Service as it provides the input data that will be used in order to perform the analytics as requested from this service. Therefore, it is important to mention that the client also interacts indirectly with the Tracking Service as the data that is requested from the Storage Service has been published there by the Tracking Service.
The output of the analytics is then published as GeoJSON-encoded feature in the Storage Service.

Figure 10 — Service interaction (Source: Testbed-17 MF participants)
10.3. Model
10.3.1. Data
In the framework of the Testbed-17 MF thread, a use case has been considered where trajectories are represented by school buses at a school parking lot while students are getting on or off the buses. The project raw data is composed of two videos of the same scenario, one recorded with a drone and the other one recorded with a GoPro camera. The input data for the Machine Analytics Client is the output data from the Tracking Service which is being stored and provided by the Storage Service. The input data has the following format:
[{'id': '7',
'tracklets': [
{'class': 'bus','time': '2021-05-27T04:03:19Z','track_id': '7','bbox': [817, 767, 145, 61],'color': [8, 0, 3],'coordinates': [-114.16073155304012, 51.085111118389406]},
{'class': 'bus','time': '2021-05-27T04:03:19Z','track_id': '7','bbox': [817, 765, 145, 61],'color': [16, 10, 16],'coordinates': [-114.16073170036974, 51.085107758370235]}]
}]
Where:
-
Class: The class of the moving feature, i.e. ‘bus’.
-
Id: Id of the moving feature of the specific class.
-
Time: Timestamp of the specific frame.
-
Track_id: The id of the tracklet for the specific moving object.
-
Bbox: Bounding box of the moving object.
-
Color: Color of the moving feature as an RGB vector.
-
Coordinates: The geographical coordinates of the moving features.
10.3.2. Analytics
Based on the data obtained from the ingestion and tracking service through the storage service, a list of analytics was performed for the use case of the school buses as follows:
-
Moving features distribution
-
Average trajectory time
-
Dwell time
-
Detection of Moving Features clusters
-
Detection of trajectory clusters
The five analytics mentioned above accomplish the objective of generating valuable information from the moving features detected in the videos. A sixth analytical process is performed in order to enrich the existing tracks by giving a more accurate vision of the moving object as a segment.
10.3.2.1. Distribution of moving features
An analysis of the distribution of the moving features through time was performed for this part, in order to achieve this, the data needs to be pre-processed obtaining a table as follows, which shows the timestamp and the moving feature ID (which corresponds to the full track of that feature).
Table 1
| Timestamp | Moving Feature ID |
|---|---|
| 2021-05-27T04:05:41Z | 185 |
Based on this, the distribution of the data was obtained by grouping the records based on the timestamp within a secondly basis and counting the number of moving objects for a determined timestamp, the output of this analytic with a JSON format will be as follows:
[{"timestamp": "2021-05-27T04:03:00Z", "count": 12},
{"timestamp": "2021-05-27T04:03:30Z", "count": 12}]
A graphical representation of the data distribution is shown below:

Figure 11 — Data distribution (Source: Testbed-17 MF participants)
10.3.2.2. Average trajectory time
The average trajectory time corresponds to a descriptive analysis on the time a moving object, in this case a bus, takes to enter and exit the parking lot. This also includes the time the bus stops for different reasons, either because children are being dropped off or because the bus is waiting for the bus in front of it to move. First, the data was processed in the same way as in the first analytic (data distribution) in order to obtain a dataframe that contains the timestamp and moving feature id as follows:
Table 2
| Timestamp | Moving Feature ID |
|---|---|
| 2021-05-27T04:05:41Z | 185 |
After that, the data was grouped based on the moving feature ID and the minimum and maximum timestamp was obtained for each moving feature ID, this means that the starting and ending time of the trajectory of each moving feature in order to calculate the delta of these two times with the aim of obtaining the time that object takes since it starts its trajectory until it finishes. The formula of the delta is as follows:
(1)
Where is the total time a moving object takes to complete a specific trajectory i, is the ending time of the trajectory i and is the initial time of trajectory i. An output sample of this analytic is shown next:
{"average_time": "00:03:11.742"}
10.3.2.3. Dwell time
The Dwell Time corresponds to the time that a moving object spends without moving in a predefined stop. In this case, it is the time that buses have to wait in front of the school entrance while the students are getting on or off the buses. An analysis on the average dwell time was performed.
Calculating dwell time requires, having as input the coordinates of the predefined stop — in this case the school entrance, given that buses can stop in any other parts of the parking lot. However, in this task only calculating the dwell time at the school entrance is of interest.
Besides the dwell time, the starting and finishing time of the trajectory are extracted as well as the full duration for a more complete overview of the trajectory. The output format is as shown below:
[{"moving_feature_id": 158, ,"start_time":"2021-05-27T04:03:00Z" ,"end_time":"2021-05-27T04:05:27Z" , "duration": 00:02:27, "dwell_time": "00:01:06"},
{"moving_Feature_id": 160, "start_time":"2021-05-27T04:07:00Z" ,"end_time":"2021-05-27T04:10:48Z" , "duration": 00:03:48, "dwell_time": "00:01:15."}]
In the above example, the field “moving_feature_id” corresponds to the field “id” from the tracklets sample format provided by the tracking service.
10.3.2.4. Detection of Moving Features clusters
The main idea behind the clusters analytic is to identify the clusters of moving objects that move together. To do so a density-based clustering technique called convoy is applied in order to give a degree of freedom to the shape of the clusters which are not necessarily circular.
A cluster is formed by a subset of density-connected points and that move together within K consecutive timestamps. Usually a DBSCAN (Density-Based Spatial Clustering of Applications with Noise, https://en.wikipedia.org/wiki/DBSCAN) is applied to form the clusters.

Figure 12 — Pattern mining (Source: “Towards Distributed Convoy Pattern Mining”)
The output of the moving feature clustering will be represented as follows:
[{"timestamp": "2021-05-13T00:09:18Z", "clusters": [{"cluster_id":0,"moving_features_ids":[121,155,158]}, {"cluster_id":1,"moving_features_ids":[123,150,151]}]},
{"timestamp": "2021-05-13T00:10:18Z", "clusters": [{"cluster_id":0,"moving_features_ids":[123,155,158]}, {"cluster_id":1,"moving_features_ids":[121,150,151]}]}]
Here, the elements that form the list in the field “moving_features_ids” correspond to the “id” field from the tracklets sample provided by the tracking service.
10.3.2.5. Detection of trajectory clusters
The idea behind this analytic is to find how many different paths could there exist between two endpoints. In this specific case there would be one because there is one specific path that buses need to follow inside the parking lot. However, this is an interesting analysis to perform when dealing with moving feature trajectories and that could be useful in the future.
In order to determine the trajectory clusters the requirement is the trajectories start and end in the same points within some small variance, a clustering method and a distance metric are used in order to identify the clusters.

Figure 13 — Trajectory. (Source:https://towardsdatascience.com/clustering-moving-object-trajectories-216c372d37e2)
The trajectory clusters output will be as follows:
[{"trajectories_ids":[161,142]},{"trajectories_ids":[163,145]}]
The elements in the field of “trajectories_ids” correspond to the “track_id” field from the tracklets output format provided by the tracking service.
10.4. Data output
The proposed output will be a JSON file with 5 keys (each key represents one of the analytics) and its values are the information obtained after performing the analytics. The sample output data will be as follows:
{
"Moving_Features_Distribution":[
{"timestamp": "2021-05-27T04:03:00Z", "count": 12},
{"timestamp": "2021-05-27T04:03:30Z", "count": 12}]
"Average_Trajectory_Time":
{"average_time": "00:03:11.742"},
"Dwell_Time":[
{"moving_feature_id": 158, ,"start_time":"2021-05-27T04:03:00Z" ,"end_time":"2021-05-27T04:05:27Z" , "duration": 00:02:27, "dwell_time": "00:01:06"},
{"moving_Feature_id": 160, "start_time":"2021-05-27T04:07:00Z" ,"end_time":"2021-05-27T04:10:48Z" , "duration": 00:03:48, "dwell_time": "00:01:15."}],
"Moving_Features_Clusters":[
{"timestamp": "2021-05-13T00:09:18Z", "clusters":[
{"cluster_id":0,"moving_features_ids":[121,155,158]},
{"cluster_id":1,"moving_features_ids":[123,150,151]}]},
{"timestamp": "2021-05-13T00:10:18Z", "clusters":[
{"cluster_id":0,"moving_features_ids":[123,155,158]},
{"cluster_id":1,"moving_features_ids":[121,150,151]}]}],
"Trajectory_Clusters":[
{"trajectories_ids":[161,142]},{"trajectories_ids":[163,145]}]
}
11. Storage Service
The storage service receives and returns moving features as JSON objects. The current format does not conform to OGC Moving Features JSON encoding (OGC 16-140r1), but this shortcoming is due to a lack of time during the development rather than a problem with JSON encoding.
JSON objects are not stored “as-is”. Instead, the objects are deconstructed: each feature type is materialized by a database table and each property such as start_time, duration, etc. is extracted and stored in a column of the feature table. This data organization is described in OGC 06-104 (Simple Features SQL). An inconvenience is that all features and properties must be known in advance since they are hard-coded both in the Java code reading JSON objects and in the database schema (note: a dynamic approach is possible but has not been implemented in this testbed). But advantages of this approach are that:
-
database index can be applied on those property values,
-
the full power of SQL expressions is available for data manipulation,
-
data can more easily be exported to other formats such as netCDF (OGC 16-114r3).
For this testbed, we used a PostgreSQL database. The bus coordinates were stored in a geometry column using the PostGIS extension. It would have been possible to go one step further by using the MobilityDB extension, which allows to store “moving geometries” instead of static geometries in a PostgreSQL database, but it is work for future improvements.
Queries can be done using either the Features web API (OGC 17-069) or by using a CQL query. CQL allows the use of more advanced filtering conditions such as “features at a distance closer than X from geometry Y”. The storage service can parse CQL and translate it to a mix of SQL and Java code. The SQL statement uses instructions such as ST_Within or ST_Intersects. A spatial database will use its index for efficient execution of those statements. If some parts of the query cannot be translated to SQL, then the storage service will execute them in Java code on the remaining features after the initial filtering done by the database.
The set of operations defined by OGC/ISO filtering encoding standard (ISO 19143) and SQLMM standard assumes static geometries. For example the above-cited example “features at a distance closer than X from geometry Y” does not take time in account. If geometries are trajectories, that operation will check the shortest distance between trajectories regardless if the moving features were actually at those locations at the same time. The ISO 19141 (Moving Features) standard defines new operators such as nearestApproach which could be used in CQL expressions. There is no OGC standard defining a filter encoding for moving features operations, but this testbed explored what they may look like (without reaching yet the point of experimenting them in the storage implementation).
The storage service is currently implemented by a simple PostgreSQL database with PostGIS extension. A future version will add the MobilityDB extension and also experiment with an alternative storage mechanism based on netCDF, but it should not impact the API.
11.1. Moving Features Endpoints
Get MovingFeatures with Feature API
The landing page is: https://tb17.geomatys.com/API/feature. It follows the OGC Features API (http://docs.ogc.org/is/17-069r3/17-069r3.html)
Get all MovingFeatures
https://tb17.geomatys.com/API/feature/collections/MovingFeatures/items
Response:
{
"type" : "FeatureCollection",
"numberMatched" : 2,
"numberReturned" : 2,
"links" : [ {
"href" : "http://tb17.geomatys.com/API/feature/collections/MovingFeatures/items",
"rel" : "self",
"type" : "application/geo+json",
"title" : "this document"
} ],
"features" : [ {
"type" : "Feature",
"properties" : {
"Moving_Features_Distribution" : [ {
"timestamp" : "2012-05-27T04:03:00Z",
"count" : 12
}, {
"timestamp" : "2012-05-27T04:03:30Z",
"count" : 12
} ],
"Average_Trajectory_Time" : {
"average_time" : "00:03:11.742"
},
"Dwell_Time" : [ {
"moving_feature_id" : 158,
"start_time" : "2012-05-27T04:03:00Z",
"end_time" : "2012-05-27T04:05:27Z",
"duration" : "00:02:27",
"dwell_time" : "00:01:06"
}, {
"moving_feature_id" : null,
"start_time" : "2012-05-27T04:07:00Z",
"end_time" : "2012-05-27T04:10:48Z",
"duration" : "00:03:48",
"dwell_time" : "00:01:15."
} ],
"Moving_Features_Clusters" : [ {
"timestamp" : "2012-05-13T00:09:18Z",
"clusters" : [ {
"cluster_id" : 0,
"moving_features_ids" : [ 121, 155, 158 ]
}, {
"cluster_id" : 1,
"moving_features_ids" : [ 123, 150, 151 ]
} ]
}, {
"timestamp" : "2012-05-13T00:10:18Z",
"clusters" : [ {
"cluster_id" : 0,
"moving_features_ids" : [ 123, 155, 158 ]
}, {
"cluster_id" : 1,
"moving_features_ids" : [ 121, 150, 151 ]
} ]
} ],
"Trajectory_Clusters" : [ {
"trajectories_ids" : [ 161, 142 ]
}, {
"trajectories_ids" : [ 163, 145 ]
} ]
}
}, {
"type" : "Feature",
"properties" : {
"Moving_Features_Distribution" : [ {
"timestamp" : "2012-05-27T04:03:00Z",
"count" : 122
}, {
"timestamp" : "2012-05-27T04:03:30Z",
"count" : 122
} ],
"Average_Trajectory_Time" : {
"average_time" : "00:03:11.742"
},
"Dwell_Time" : [ {
"moving_feature_id" : 159,
"start_time" : "2012-05-27T04:03:00Z",
"end_time" : "2012-05-27T04:05:27Z",
"duration" : "00:02:27",
"dwell_time" : "00:01:06"
}, {
"moving_feature_id" : null,
"start_time" : "2012-05-27T04:07:00Z",
"end_time" : "2012-05-27T04:10:48Z",
"duration" : "00:03:48",
"dwell_time" : "00:01:15."
} ],
"Moving_Features_Clusters" : [ {
"timestamp" : "2012-05-13T00:09:18Z",
"clusters" : [ {
"cluster_id" : 0,
"moving_features_ids" : [ 121, 155, 158 ]
}, {
"cluster_id" : 1,
"moving_features_ids" : [ 123, 150, 151 ]
} ]
}, {
"timestamp" : "2012-05-13T00:10:18Z",
"clusters" : [ {
"cluster_id" : 0,
"moving_features_ids" : [ 123, 155, 158 ]
}, {
"cluster_id" : 1,
"moving_features_ids" : [ 121, 150, 151 ]
} ]
} ],
"Trajectory_Clusters" : [ {
"trajectories_ids" : [ 161, 142 ]
}, {
"trajectories_ids" : [ 163, 145 ]
} ]
}
} ]
}
Get MovingFeatures simple REST API
-
Get all MovingFeatures
Request: GET https://tb17.geomatys.com/API/MovingFeatures
Response:
[
{
"Moving_Features_Distribution": [
{
"timestamp": "2012-05-27T04:03:00Z",
"count": 12
}, {
"timestamp": "2012-05-27T04:03:30Z",
"count": 12
}
],
"Average_Trajectory_Time": {
"average_time": "00:03:11.742"
},
"Dwell_Time": [
{
"moving_feature_id": 158,
"start_time": "2012-05-27T04:03:00Z",
"end_time": "2012-05-27T04:05:27Z",
"duration": "00:02:27",
"dwell_time": "00:01:06"
}, {
"moving_Feature_id": 160,
"start_time": "2012-05-27T04:07:00Z",
"end_time": "2012-05-27T04:10:48Z",
"duration": "00:03:48",
"dwell_time": "00:01:15."
}
],
"Moving_Features_Clusters": [
{
"timestamp": "2012-05-13T00:09:18Z",
"clusters": [{
"cluster_id": 0,
"moving_features_ids": [121, 155, 158]
}, {
"cluster_id": 1,
"moving_features_ids": [123, 150, 151]
}]
}, {
"timestamp": "2012-05-13T00:10:18Z",
"clusters": [{
"cluster_id": 0,
"moving_features_ids": [123, 155, 158]
}, {
"cluster_id": 1,
"moving_features_ids": [121, 150, 151]
}]
}
],
"Trajectory_Clusters": [
{
"trajectories_ids": [161, 142]
}, {
"trajectories_ids": [163, 145]
}
]
}
]
-
Add a new MovingFeature with POST
Request: POST https://tb17.geomatys.com/API/MovingFeatures Body:
{
"Moving_Features_Distribution": [
{
"timestamp": "2012-05-27T04:03:00Z",
"count": 12
}, {
"timestamp": "2012-05-27T04:03:30Z",
"count": 12
}
],
"Average_Trajectory_Time": {
"average_time": "00:03:11.742"
},
"Dwell_Time": [
{
"moving_feature_id": 158,
"start_time": "2012-05-27T04:03:00Z",
"end_time": "2012-05-27T04:05:27Z",
"duration": "00:02:27",
"dwell_time": "00:01:06"
}, {
"moving_Feature_id": 160,
"start_time": "2012-05-27T04:07:00Z",
"end_time": "2012-05-27T04:10:48Z",
"duration": "00:03:48",
"dwell_time": "00:01:15."
}
],
"Moving_Features_Clusters": [
{
"timestamp": "2012-05-13T00:09:18Z",
"clusters": [{
"cluster_id": 0,
"moving_features_ids": [121, 155, 158]
}, {
"cluster_id": 1,
"moving_features_ids": [123, 150, 151]
}]
}, {
"timestamp": "2012-05-13T00:10:18Z",
"clusters": [{
"cluster_id": 0,
"moving_features_ids": [123, 155, 158]
}, {
"cluster_id": 1,
"moving_features_ids": [121, 150, 151]
}]
}
],
"Trajectory_Clusters": [
{
"trajectories_ids": [161, 142]
}, {
"trajectories_ids": [163, 145]
}
]
}
Response:
{
Moving Features successfully added
}
Pushing MovingFeatures with MQTT
The format for sending MovingFeatures via MQTT is the same as with the POST message.
{
protocol = "tcp";
hostName = "tb17.geomatys.com";
port = "30170";
clientId = "tb17-client";
topic = "/MovingFeatures"
}
11.2. Observations Endpoints
Get Observations with Feature API
The landing page is https://tb17.geomatys.com/API/feature. It follows the OGC Features API (http://docs.ogc.org/is/17-069r3/17-069r3.html)
-
Get All Observations
https://tb17.geomatys.com/API/feature/collections/Observation/items
Example :
{
"type": "FeatureCollection",
"numberMatched": 3,
"numberReturned": 3,
"links": [
{
"href": "http://tb17.geomatys.com/API/feature/collections/Observation/items",
"rel": "self",
"type": "application/geo+json",
"title": "this document"
}
],
"features": [
{
"type": "Feature",
"id": 1,
"geometry": {
"type": "Point",
"coordinates": [
-116.1608,
50.0851
]
},
"properties": {
"observation_id": 1,
"tracklet_id": 23,
"class": "bus",
"time": "2021-07-29T04:04:03Z",
"color": [44,33,22],
"bbox": [944.0,765.0,123.0,59.0]
}
},
{
"type": "Feature",
"id": 2,
"geometry": {
"type": "Point",
"coordinates": [
-117.1608,
51.0851
]
},
"properties": {
"observation_id": 2,
"tracklet_id": 23,
"class": "bus",
"time": "2021-07-29T04:05:03Z",
"color": [44,33,22],
"bbox": [944.0,765.0,123.0,59.0]
}
}
]
}
-
Get a specific Observation by id.
https://tb17.geomatys.com/API/feature/collections/Observation/items/"id"
-
Observation filter by bbox
https://tb17.geomatys.com/API/feature/collections/Observation/items?bbox=-120,-90,180,90
Get Observations with STA API
-
Get All Observations
https://tb17.geomatys.com/API/STA/Observations
example:
{
"value": [
{
"phenomenonTime": "2021-07-29T04:04:03Z",
"result": 23,
"resultTime": "2021-07-29T04:04:03Z",
"@iot.id": "1",
"@iot.selfLink": "http://tb17.geomatys.com/API/STA/Observations(1)",
"FeatureOfInterest": {
"name": "48,-114.16081989038098,51.085107555986895",
"description": "CSLT BusMovingObject",
"encodingType": "application/vnd.geo+json",
"feature": {
"type": "Feature",
"properties": {
"image_bbox": [944.0,765.0,123.0,59.0],
"image_color": [44,33,22],
"class": "bus"
},
"geometry": {
"type": "Point",
"coordinates": [-116.16081989038098, 50.085107555986895]
}
}
},
"Datastream@iot.navigationLink": "http://tb17.geomatys.com/API/STA/Observation(1)/Datastreams"
},
{
"phenomenonTime": "2021-07-29T04:05:03Z",
"result": 23,
"resultTime": "2021-07-29T04:05:03Z",
"@iot.id": "2",
"@iot.selfLink": "http://tb17.geomatys.com/API/STA/Observations(2)",
"FeatureOfInterest": {
"name": "48,-114.16081989038098,51.085107555986895",
"description": "CSLT BusMovingObject",
"encodingType": "application/vnd.geo+json",
"feature": {
"type": "Feature",
"properties": {
"image_bbox": [944.0,765.0,123.0,59.0],
"image_color": [44,33,22],
"class": "bus"
},
"geometry": {
"type": "Point",
"coordinates": [-117.16081989038098, 51.085107555986895]
}
}
},
"Datastream@iot.navigationLink": "http://tb17.geomatys.com/API/STA/Observation(2)/Datastreams"
}
]
}
-
Get a specific Observation by id.
https://tb17.geomatys.com/API/STA/Observations("id")
Pushing Observations with MQTT
The server takes a STA Observation as input. The Observation result will be recorded as the tracklet_id. Multiple observations can refer to the same tracklet id.
A unique Observation id will be generated during the insertion.
{
"phenomenonTime": "2021-07-27T04:03:03Z",
"resultTime": "2021-07-27T04:03:03Z",
"result": 48,
"FeatureOfInterest": {
"name": "48,-114.16081989038098,51.085107555986895",
"description": "BusMovingObject",
"encodingType": "application/vnd.geo+json",
"feature": {
"type": "Feature",
"properties": {
"image_bbox": [944.0,765.0,123.0,59.0],
"image_color": [44,33,22],
"class": "bus"
},
"geometry": {
"type": "Point",
"coordinates": [-114.16081989038098, 51.085107555986895]
}
}
},
"Datastream": {
"@iot.id": 60987
}
}
In the current implementation, data can only be sent via MQTT. The broker is described below, and a Java code example is available on GitLab. The port and topic values in Java code may need to be edited with coordinates shown below:
{
protocol = "tcp";
hostName = "tb17.geomatys.com";
port = "30170";
clientId = "tb17-client";
topic = "/Observations";
}
11.3. Tracklets Endpoints
Get Tracklets with Feature API
The landing page is https://tb17.geomatys.com/API/feature. It follows the OGC Features API (http://docs.ogc.org/is/17-069r3/17-069r3.html)
11.3.1. Get All tracklets
https://tb17.geomatys.com/API/feature/collections/Tracklet/items
Example:
{
"type" : "FeatureCollection",
"numberMatched" : 2,
"numberReturned" : 2,
"links" : [ {
"href" : "http://tb17.geomatys.com/API/feature/collections/Tracklet/items",
"rel" : "self",
"type" : "application/geo+json",
"title" : "this document"
} ],
"features" : [ {
"type" : "Feature",
"id" : 23,
"properties" : {
"id" : 23,
"observations" : [ {
"type" : "Feature",
"id" : 1,
"geometry" : {
"type" : "Point",
"coordinates" : [ -114.1607229123794, 51.085108121171366 ]
},
"properties" : {
"observation_id" : 1,
"tracklet_id" : 23,
"class" : "bus",
"time" : "2021-07-29T04:04:03Z",
"color" : [ 44, 33, 22 ],
"bbox" : [ 944.0, 765.0, 123.0, 59.0 ]
}
}, {
"type" : "Feature",
"id" : 2,
"geometry" : {
"type" : "Point",
"coordinates" : [ -116.1607229123794, 52.085108121171366 ]
},
"properties" : {
"observation_id" : 2,
"tracklet_id" : 23,
"class" : "bus",
"time" : "2021-07-29T04:05:03Z",
"color" : [ 44, 33, 22 ],
"bbox" : [ 944.0, 765.0, 123.0, 59.0 ]
}
} ]
}
}, {
"type" : "Feature",
"id" : 24,
"properties" : {
"id" : 24,
"observations" : [ {
"type" : "Feature",
"id" : 3,
"geometry" : {
"type" : "Point",
"coordinates" : [ -116.1607229123794, 52.085108121171366 ]
},
"properties" : {
"observation_id" : 3,
"tracklet_id" : 24,
"class" : "bus",
"time" : "2021-07-29T06:05:03Z",
"color" : [ 44, 33, 22 ],
"bbox" : [ 944.0, 765.0, 123.0, 59.0 ]
}
} ]
}
} ]
}
-
Get a specific tracklet by id.
https://tb17.geomatys.com/API/feature/collections/Tracklet/items/"id"
-
Tracklet filter by bbox
https://tb17.geomatys.com/API/feature/collections/Tracklet/items?bbox=-120,-90,180,90
NB: Tracklets are automatically created by regrouping observations with the same tracklet_id
11.4. Tracks Endpoints
Get Tracks with Feature API
The landing page is https://tb17.geomatys.com/API/feature. It follows the OGC Features API (http://docs.ogc.org/is/17-069r3/17-069r3.html)
-
Get All tracks
https://tb17.geomatys.com/API/feature/collections/Track/items
Example:
{
"type" : "FeatureCollection",
"numberMatched" : 1,
"numberReturned" : 1,
"links" : [ {
"href" : "http://tb17.geomatys.com/API/feature/collections/Track/items",
"rel" : "self",
"type" : "application/geo+json",
"title" : "this document"
} ],
"features" : [ {
"type" : "Feature",
"id" : 35,
"properties" : {
"id" : 35,
"tracklets" : [ {
"type" : "Feature",
"id" : 1,
"geometry" : {
"type" : "Point",
"coordinates" : [ -116.1607229123794, 52.085108121171366 ]
},
"properties" : {
"observation_id" : 1,
"tracklet_id" : 23,
"class" : "bus",
"time" : "2021-07-29T04:04:03Z",
"color" : [ 44, 33, 22 ],
"bbox" : [ 944.0, 765.0, 123.0, 59.0 ]
}
}, {
"type" : "Feature",
"id" : 2,
"geometry" : {
"type" : "Point",
"coordinates" : [ -116.1607229123794, 52.085108121171366 ]
},
"properties" : {
"observation_id" : 2,
"tracklet_id" : 23,
"class" : "bus",
"time" : "2021-07-29T04:05:03Z",
"color" : [ 44, 33, 22 ],
"bbox" : [ 944.0, 765.0, 123.0, 59.0 ]
}
}, {
"type" : "Feature",
"id" : 3,
"geometry" : {
"type" : "Point",
"coordinates" : [ -116.1607229123794, 52.085108121171366 ]
},
"properties" : {
"observation_id" : 3,
"tracklet_id" : 24,
"class" : "bus",
"time" : "2021-07-29T06:05:03Z",
"color" : [ 44, 33, 22 ],
"bbox" : [ 944.0, 765.0, 123.0, 59.0 ]
}
} ]
}
} ]
}
-
Get a specific track by id.
https://tb17.geomatys.com/API/feature/collections/Track/items/"id"
-
Track filter by bbox
https://tb17.geomatys.com/API/feature/collections/Track/items?bbox=-120,-90,180,90
Pushing Tracks with MQTT
The server takes a simple object linking a track id and a list of tracklet identifiers.
{
"track_id": 35,
"tracklet_ids": [23, 24]
}
In the current implementation, data can only be sent via MQTT. The broker is described below, and a Java code example is available on GitLab. The port and topic values in Java code may need to be edited with coordinates shown below:
{
protocol = "tcp";
hostName = "tb17.geomatys.com";
port = "30170";
clientId = "tb17-client";
topic = "/Tracks"
}
11.5. SensorThings Endpoints
Add new Thing with embedded datastream
Request: POST https://tb17.geomatys.com/API/STA/Things
Body:
{
"name": "thing test",
"description": " description du things test",
"Datastreams": [{
"description": " description du datastream test"
}]
}
Response:
{
"name": "thing test",
"description": " description du things test",
"@iot.id": "2",
"@iot.selfLink": "https://tb17.geomatys.com/API/STA/Things(2)",
"Datastreams": [
{
"description": " description du datastream test",
"@iot.id": "2",
"@iot.selfLink": https://tb17.geomatys.com/API/STA/Datastreams(2),
"Thing@iot.navigationLink": "https://tb17.geomatys.com/API/STA/Things(2)"
}
]
}
Get All Things:
Request: https://tb17.geomatys.com/API/STA/Things
Example of response:
[
{
"@iot.id": "1",
"@iot.selfLink": "https://tb17.geomatys.com/API/STA/Things(1)",
"Datastreams@iot.navigationLink": "https://tb17.geomatys.com/API/STA/Things(1)/Datastreams"
},
{
"name": "thing test",
"description": " description du things test",
"@iot.id": "2",
"@iot.selfLink": "https://tb17.geomatys.com/API/STA/Things(2)",
"Datastreams@iot.navigationLink": "https://tb17.geomatys.com/API/STA/Things(2)/Datastreams"
}
]
An optional expand parameter can be added as below:
Request: https://tb17.geomatys.com/API/STA/Things?$expand=Datastreams
Example of response:
[
{
"@iot.id": "1",
"@iot.selfLink": "https://tb17.geomatys.com/API/STA/Things(1)",
"Datastreams": [
{
"@iot.id": "1",
"@iot.selfLink": "https://tb17.geomatys.com/API/STA/Datastreams(1)",
"Thing@iot.navigationLink": "https://tb17.geomatys.com/API/STA/Things(1)"
}
]
},
{
"name": "thing test",
"description": " description du things test",
"@iot.id": "2",
"@iot.selfLink": "https://tb17.geomatys.com/API/STA/Things(2)",
"Datastreams": [
{
"description": " description du datastream test",
"@iot.id": "2",
"@iot.selfLink": "https://tb17.geomatys.com/API/STA/Datastreams(2)",
"Thing@iot.navigationLink": "https://tb17.geomatys.com/API/STA/Things(2)"
}
]
}
]
Get Thing by id:
Request: https://tb17.geomatys.com/API/STA/Things(2)
Example of response:
{
"name": "thing test",
"description": " description du things test",
"@iot.id": "2",
"Datastreams@iot.navigationLink": "https://tb17.geomatys.com/API/STA/Things(2)/Datastreams"
}
An optional expand parameter can be added as below:
Request: https://tb17.geomatys.com/API/STA/Things(2)?$expand=Datastreams
Example of response:
{
"name": "thing test",
"description": " description du things test",
"@iot.id": "2",
"Datastreams": [
{
"description": " description du datastream test",
"@iot.id": "2",
"@iot.selfLink": "https://tb17.geomatys.com/API/STA/Datastreams(2)",
"Thing@iot.navigationLink": "https://tb17.geomatys.com/API/STA/Things(2)"
}
]
}
Get Datastream for thing:
Request: https://tb17.geomatys.com/API/STA/Things(2)/Datastreams
Example of response:
[
{
"description": " description du datastream test",
"@iot.id": "2",
"@iot.selfLink": "https://tb17.geomatys.com/API/STA/Datastreams(2)",
"Thing@iot.navigationLink": "https://tb17.geomatys.com/API/STA/Things(2)"
}
]
Get All datastreams:
Request: https://tb17.geomatys.com/API/STA/Datastreams
Example of response:
[
{
"@iot.id": "1",
"@iot.selfLink": "https://tb17.geomatys.com/API/STA/Datastreams(1)",
"Thing@iot.navigationLink": "https://tb17.geomatys.com/API/STA/Things(1)"
},
{
"description": " description du datastream test",
"@iot.id": "2",
"@iot.selfLink": "https://tb17.geomatys.com/API/STA/Datastreams(2)",
"Thing@iot.navigationLink": "https://tb17.geomatys.com/API/STA/Things(2)"
}
]
Get datastream by id:
Request: https://tb17.geomatys.com/API/STA/Datastreams(2)
Example of response:
{
"description": " description du datastream test",
"@iot.id": "2",
"@iot.selfLink": "https://tb17.geomatys.com/API/STA/Datastreams(2)",
"Thing@iot.navigationLink": "https://tb17.geomatys.com/API/STA/Things(2)"
}
Using CQL:
Request: https://tb17.geomatys.com/API/feature/collections/Tracklet/items?limit=20&filter=id=2
Response is similar to other queries, only the way to write the query is different.
12. Autonomous Vehicle Analysis With WebVMT
12.1. Scope
Following on from work in the Testbed-16, Web Video Map Track (WebVMT) has been used to previzualize and analyze multi-sensor data from an autonomous vehicle in the Testbed-17 initiative.
Ordnance Survey provided video and lidar data from a StreetDrone vehicle navigating the roads around their headquarters in Southampton, UK. The footage was shot from a front-facing camera on the vehicle and shows a number of moving objects including a cyclist, pedestrians and other road vehicles as well as static objects such as hedges, road signs and lamp posts.

Figure 14 — Vehicle Trajectory And Lidar Detections Including Traffic Island
Being able to accurately identify and track moving objects from another moving object is critical to the successful operation of autonomous vehicles. The aim was to demonstrate how value can be added by aggregation of data from multiple sensors and integration with web map APIs in a browser using WebVMT.
12.2. Use Case
An autonomous vehicle must be able to:
-
detect nearby objects;
-
correctly assess any threat these may pose;
-
respond accordingly.
Different courses of action are required to avoid collisions with stationary obstructions than moving vehicles so correct identification of these objects is critical to the safe operation of the vehicle.
Capturing detection data from a moving vehicle makes the process of identifying stationary objects more complicated as the detector’s frame of reference is also moving. Allowance should be made for errors in the position measurement and co-ordinate transformation calculations to ensure that stationary objects are correctly recognized. Once static detections are eliminated, moving objects can be found more easily by associating the remaining detections as the search space has been reduced.

Figure 15 — Filtered Detections With Moving Cyclist Highlighted And Static Traffic Island Removed
Associating observations captured by multiple cameras enables autonomous vehicles to track the same object observed at different times and by different sensors which could help improve operational performance. Vehicles could make smarter driving decisions and better anticipate the actions of the moving objects around them. For example, an autonomous vehicle in a car park should be able to accurately discriminate between parked and moving vehicles. Human brains find this process simple, but programming a machine to correctly recognize that one vehicle is moving and another is stationary is more difficult when the camera itself is also moving.
12.3. Data Analysis
StreetDrone data contain location and orientation information for the vehicle and lidar object detection data at 100ms resolution. All location data are stored in British National Grid (BNG) co-ordinates and lidar detections are recorded in the vehicle’s frame of reference with the x co-ordinate aligned to the front.
Analysis was performed in the following steps:
-
Export the vehicle location over time to WebVMT and convert the co-ordinates from BNG to World Geodetic System 1984 (WGS84) for web map API compatibility.
-
Combine vehicle location and orientation, which constitute OGC GeoPose, with lidar detections and export these to WGS84 world co-ordinates in WebVMT format for web browser compatibility to enable previzualisation and analysis.
-
Identify stationary detections over time and remove these to leave the moving detection data.
-
Aggregate the remaining detections into moving object trajectories and associate these with moving objects observed in the video footage.
Detections can be associated into trajectories by predicting the next location based on previous velocity and choosing the nearest detection to the prediction. Eliminating static detections in a preliminary step avoids trajectories becoming trapped at the initial location.

Figure 16 — Associating Detections With Moving Object
12.4. Results
A suite of tools was developed to manipulate files in WebVMT format, including:
-
export timed geospatial data to WebVMT as either trajectories or as discrete locations;
-
identify static and moving objects from detections;
-
associate discrete detections into trajectory segments with metrics to link segments into longer trajectories;
-
filter data to isolate or eliminate identified features;
-
merge data from multiple files into a single aggregated file.
Applying these tools to the StreetDrone video and lidar data allowed the cyclist’s trajectory to be successfully identified and tracked. This trajectory was exported as a WebVMT path along with the StreetDone vehicle’s location to provide context for the video image.

Figure 17 — Tracking Moving Cyclist From Moving Vehicle
In addition to the cyclist, short trajectories were also identified for other moving objects observed in video.
Table 3
| Track | Start | End | Distance Travelled | Average Speed |
| Cyclist | 0:09.8 | 1:25.4 | 362.4 m | 17.2 km/h (10.7 mph) |
| Pedestrian | 0:15.8 | 0:21.3 | 11.2 m | 7.3 km/h (4.5 mph) |
| Oncoming Car | 1:44.6 | 1:45.6 | 6.3 m | 22.6 km/h (14.1 mph) |
12.5. Conclusions
Moving objects were successfully tracked by combining data from multiple sensors mounted on a moving platform. Matching object trajectories to synchronized motion imagery data enabled visual identification of the tracked object for more accurate discrimination of observations. Calculation of movement attributes increased confidence in correct identification by confirming that values were in the expected range for that object type, such as speed, which can be calculated even from short tracks with a one-second duration.
Rapid previzualization of data in a web browser using WebVMT enabled analysis to be performed with reusable software tools and to interface with web technologies that leverage online map presentation APIs and cartographic data from multiple providers.
Further areas for investigation were also identified, which are detailed in the Future Work section of this report.
13. Moving features TIE tracking
13.1. TIE summary table
Table 4
| Server\Client | D135 Ingestion Service 1 | D135a Ingestion Service in-kind | D136 Ingestion Service 2 | D137 Tracker Service | D139 Machine Analytics Client | D140 Human Analytics Client |
|---|---|---|---|---|---|---|
| D141 Storage Service | 2/2 | 0/2 | 2/2 | 0/2 | 0/2 | 0/2 |
13.1.1. Test status for D135
-
Function 1: Initialization of Thing
-
Description: Try to get Thing ID from local database. If it does not exist try to get Thing ID from the Storage Service. If it does not exist create a POST request to create the Thing and Datastream using the SensorThings API.
-
Client Action:
-
Check local database for Thing ID
-
If Thing ID not found, POST request to get Thing. [ 1) Execute GET request ‘https://tb17.geomatys.com/API/STA/Things?$expand=Datastreams’ (2) Loop through and match on name]
-
If Thing not found, POST request to create Thing and Datastream. [ 1) Execute POST request ‘https://tb17.geomatys.com/API/STA/Things’ with JSON Thing as request body]
-
-
Server Response:
-
[No Request made to Storage service]
-
SensorThing’s Thing array.
-
SensorThing’s JSON for the created Thing and Datastream.
-
-
Success Criterion: Thing and Datastream exist in the Storage Service with all the correct data. [ 1) Execute GET request ‘https://tb17.geomatys.com/API/STA/Things?$expand=Datastreams’ (2) Inspect response to ensure Thing and Datastream exist and have the correct values]
-
Function 2: Publish Observation using MQTT.
-
Description: Build a SensorThings Observation JSON using the raw sensor data and Publish it to the Storage Services MQTT broker.
-
Client Action:
-
Create Observation JSON from raw data.
-
Publish Observation using MQTT to the Storage Service.
-
-
Server Response:
-
[No Request made to Storage service]
-
[No response]
-
-
Success Criterion: Data from the Observation payload exists in the Storage Service as a Feature [Execute GET request ‘https://tb17.geomatys.com/API/feature’ (2) Inspect response to ensure feature exists with the published content as a OGC Feature].
13.1.2. Test status for D136
-
STA formatting and publish to Storage service
Function: STA formatting and publish to Storage service.
Description: This function gets transformed tracklets and convert them into STA format then publish them into the storage service.
Client Action: Get tracklets and store them as MF objects.
Server Response: Published acknowledgment was received in the ingestion service.
Success Criterion: Data visible in the internal storage in https://tb17.geomatys.com/API/feature/collections/Tracklet/items?limit=100 .
-
Register Things
Function: Register Things.
Description: Things write to storage.
Client Action: Register cameras and videos as Things STA data model to the storage service.
Server Response: {"name":"DroneDIJ5433_Test1","description":"The camera for the monitoring school bus from a drone.","properties":{"Deployment Condition":"Deployed on a drone","Case Used":"Testbed17","Raw video URL":"https://drive.google.com/file/d/1uVrOWpmG-UiPh-4IM8A9LInoTfmjouNl/view?usp=sharing","Transformation Parameters":{"GCP":[[-114.161616,51.08494],[-114.16178,51.084679],[-114.160671,51.084689],[-114.160777,51.085036]],"IMC":[[1856,747],[1770,660],[823,667],[935,788]]}},"@iot.id":"14","@iot.selfLink":"{"description":"Detected objects of the Drone video streams","@iot.id":"14"}}
Success Criterion: Data visible in the internal storage in this address https://tb17.geomatys.com/API/STA/Thing .
13.1.3. Test status for D137
-
Function 1: Observations Request
-
Description: Obtain observations(tracklets) from the Observation API
-
Client Action: Requestion observations via the Observation API executing GET REQUEST (https://tb17.geomatys.com/API/feature/collections/Tracklet/items)
-
Server Response: JSON with the observations published by the Ingestion Service
-
Success Criterion: Response status code 200
-
-
Function 2: Generate Tracks by the tracking algorithm
-
Description: Use observations as the input for the tracking algorithm, connect observations from the same object together and produce tracks for each object
-
Client Action:
-
Group observations by sampling time and tracklet ids;
-
Predict next possible location in the next time point and find the most suitable observation
-
Connect tracklets into tracks and format the output as JSON file
-
-
Server Response:
-
[No Request made to Storage Service]
-
[No Response]
-
-
Success Criterion: Tracks are correctly generated and outputted
-
-
Function 3: Publish Tracks to the Storage Service via MQTT
-
Description: Publish each track with JSON format to the storage service via MQTT
-
Client Action: Publish tracks to the storage service
-
Server Response: status of 0 indicating successful publishing
-
Success Criterion: Tracks can be shown in the tracks endpoint. A GET Request is performed using https://tb17.geomatys.com/API/feature/collections/Track/items to verify the success of the operation
-
13.1.4. Test status for D139
-
Function 1: Tracklets request
-
Description: Obtain the tracklets from Features API.
-
Client Action: Request tracklets via the moving features API executing GET REQUEST (https://tb17.geomatys.com/API/feature/collections/Tracklet/items)
-
Server Response: JSON with the tracklets published before by the tracking service
-
Success Criterion: Response status code 200
-
Function 2: Format data and create analytics
-
Description: Put the input tracklets data in the proper format and perform each of the five analytics
-
Client Action:
-
For each analytic, process the data until obtaining the right format and information to be used.
-
Perform each of the five analytics.
-
Format the output to zip together the five analytics as a JSON.
-
-
Server Response:
-
[No Request made to Storage service]
-
[No response]
-
-
Success Criterion: Analytics are correctly performed and outputted
-
Function 3: Publish Moving Feature Analytics with POST
-
Description: Publish the JSON obtained in the previous function onto the storage service.
-
Client Action: Publish analytics in the storage service
-
Server Response:
-
[No Request made to Storage service]
-
[No response]
-
-
Success Criterion: Analytics exist in the Storage Service. A GET Request is performed using https://tb17.geomatys.com/API/MovingFeatures to verify the success of the operation.
13.1.5. Test status for D140
-
Function 1
-
Description: Obtain Track data (aggregated tracklets) from the Track API
-
Client Action: Requesting Tracks via the Track API executing GET REQUEST (https://tb17.geomatys.com/API/feature/collections/Track/items)
-
Server Response: JSON with the Tracks published by the Ingestion Service
-
Success Criterion: Response status code 200
-
-
Function 2
-
Description: Parse and visualize the JSON response containing the track data
-
Client Action:
-
A list view that contains all loaded tracks and corresponding information. It enables highlighting any specific track on the map by selecting its entry in the list.
-
An animated view that visualized the movement of the retrieved track data, controlled by the time widget.
-
An aggregated statistics view along the time dimension, which implemented as a histogram-like view that overlays on the time widget, presenting the tracklet density of each time period.
-
An aggregated statistics view in terms of spatial dimension, which overlays hexagon bars on the map to present the tracklet density of each corresponding small hexagon area. This view can intuitively tell the traffic congestion.
-
A map layer that plays the cropped and projected video clip, which provides the raw reference for the animated track data.
-
-
Server Response: N/A
-
Success Criterion: All kinds of information are correctly presented and synchronized.
-
Data retrieval issues solved with the help of the Ingestion Service:
-
The number of coordinates does not match the number of tracklets
-
The precision of tracklet coordinates is low (4 numbers in coords)
-
Cross-Origin Resource Sharing (CORS) issue
14. Future Work and Recommendations
14.1. Ingestion service
-
Update the framework to support stateless SensorThings. This will eliminate the need to perform HTTP POST requests from the Ingestion service to the Storage service.
-
Update Ingestion service to temporarily store observations locally. This will prevent data loss if the Storage service goes offline.
-
Currently the ingestion service processes only the reported properties but could do more.
-
The developed ingestion service was designed to ingest observations from static/fixed cameras. So, the entire process including detection, tracking, transformation, and SensorThings API (STA) model was based on the assumption of having a fixed camera. Therefore, it is highly recommended to test and implement an ingestion service to handle both fixed and moving camera observations.
-
Improving the transformation accuracy would be another suggestion for future work. In this project, there were no camera EXIF files available and the homography algorithm was used to transform coordinates based on a set of control points. This method gives errors in many parts of the video especially outside of the control points area because of the perspective effect.
-
Automation of registering Things based on the stateless STA data model would help to get data from new sources.
14.2. Machine analytics client
The following are the recommendations for future work for the Machine Analytics Client (see detail in respective chapters).
14.2.1. Segmentation of detected Moving Features
The scope of this subtask was to create an image segmentation based on a prior bounding box, creating an accurate semantic segmentation of the detected moving feature. Given the bounding box as an input, the correspondent semantic segmentation will acquire taking into account just the content inside of the bounding box.

Figure 18 — Segmentation. (Source: “Image Segmentation with A Bounding Box Prior”)
In order to achieve this, a Convolutional Neural Network (CNN) method should be adopted, trained with images and their bounding boxes using multiple instance learning by leveraging the tightness property of the object which states that the detected instance touches the four sides of the bounding box.
14.2.2. Seasonality Analysis
The objective of a seasonality analysis is to take as input data conditioned on the season in which they were retrieved in order to find the difference in patterns among the data based on the different seasons with the aim of identifying the effect that the time in which the data was retrieved has on the behavior and the distribution of it.
14.3. Autonomous vehicle use case
A number of interesting areas were identified for future investigation, including:
-
combining multi-sensor data to improve detection accuracy and cognitive guidance;
-
data aggregation to associate segmented trajectories from spatially-distributed sensors;
-
autonomous location reporting of obstructions to moving objects;
-
combination of multi-angle sensor data to track nearby vehicles and obstacles;
-
use of spatially-distributed data for pre-emptive responses.
14.3.1. Multi-Sensor Detection Analysis
Having established baseline metrics for moving objects observed in Testbed-17 StreetDrone data, comparisons could be made with visual detection methods. Combining video camera GeoPose with perspective imagery techniques would enable locations of observed objects to be calculated and compared with results from lidar data to quantify the associated errors, particularly for the near-horizontal observations which are commonplace in autonomous vehicle use cases.
This process could also be applied in reverse to project an overlay of lidar detection locations on the video footage indicating where observed objects appear in the frame. Combining data from multiple sensors in this way could improve identification of detections from video data by guiding human analysis and adding value to machine processing.
14.3.2. Traffic Camera Automation
Data from multiple static cameras with known GeoPose, such as roadside traffic cameras, could be combined to track moving objects observed by different cameras at different times and to aggregate segmented information over longer intervals. Vehicle speeds, lane usage and transit times could be analyzed under different driving conditions observed from video footage, including factors such as weather, visibility and traffic density. Cameras monitoring approach roads to a junction could enable anonymized vehicle trajectories to be determined and help improve modelling of traffic flows through that intersection, though care should be taken to safeguard citizens’ privacy rights.
Automatic systems could identify obstructions in the carriageway from camera pixels that cease to change and report this autonomously by using GeoPose and perspective imagery to calculate the precise location of the blockage.
14.3.3. Collision Avoidance
Autonomous vehicles typically have multiple video cameras observing different fields of view around the vehicle. Aggregating data from more than one camera would enable nearby objects to be tracked more intelligently, allowing the autonomous system to better predict their behavior and correctly select the safest course of action. For example, a vehicle travelling on a motorway could monitor traffic in the surrounding lanes by combining observations from front, side and rear cameras. If this information is aggregated, the location of a passing vehicle could be tracked and predicted while passing through a blind spot despite the absence of any direct observation. This use case also extends to avoiding static obstacles during slow-speed maneuvers such as parking.
Widening data aggregation to include both roadside and on-board cameras would enable vehicles to react to threats beyond their own line of sight, such as an obstruction in the lane ahead, and respond pre-emptively by changing lanes and slowing down. Such behavior could also have a halo effect on the surrounding vehicles, which may not be autonomous, by alerting them to the impending threat.
Synchronization is a key issue for data aggregation as small timing discrepancies can result in significant misjudgements of location, due to the speeds involved, which could have serious safety implications. One way to mitigate timing issues is to bake video streams together into a single frame. Comparison between single frame and identical multi-frame footage with artificial latency would allow this issue to be accurately quantified.

Figure 19 — Motorcycle With Front and Rear Cameras.
Annex A
(informative)
Revision History
| Date | Release | Author | Primary clauses modified | Description |
|---|---|---|---|---|
| May, 2021 | .1 | G. Schumann | all | IER version |
| September, 2021 | .1 | G. Schumann | all | Draft ER version finalized for first review by Carl Reed |
| October, 2021 | .1 | G. Schumann | all | First draft ER version ready; implemented comments received |
| November, 2021 | .1 | G. Schumann | all | Second draft ER version ready; implemented comments received by Gobe Hobona and participants |
Bibliography
[1] Huang, Rachel, Jonathan Pedoeem, and Cuixian Chen. “YOLO-LITE: a real-time object detection algorithm optimized for non-GPU computers.” In 2018 IEEE International Conference on Big Data (Big Data), pp. 2503-2510. IEEE, 2018.
[2] Bewley, Alex, Zongyuan Ge, Lionel Ott, Fabio Ramos, and Ben Upcroft. “Simple online and real-time tracking.” In 2016 IEEE international conference on image processing (ICIP), pp. 3464-3468. IEEE, 2016.
[3] Liang, Steve HL, Sara Saeedi, Soroush Ojagh, Sepehr Honarparvar, Sina Kiaei, Mahnoush Mohammadi Jahromi, and Jeremy Squires. “An Interoperable Architecture for the Internet of COVID-19 Things (IoCT) Using Open Geospatial Standards—Case Study: Workplace Reopening.” Sensors 21, no. 1 (2021): 50.
[4] Orakzai, Faisal; Devogele, Thomas and Calders, Toon. Towards Distributed Convoy Pattern Mining. 2015.
[5] Liu, Siyuan; Wang; Shuhui and Qu Qiang; Trajectory Mining; 2017
[6] Figueira, Joao Paulo. Clustering Moving Object Trajectories; 2020
[7] Hsu, Cheng-Chun; Hsu, Kuang-Jui; Tsai, Chung-Chi; Lin, Wen-Yu and Chuang, Yung-Yu. Weakly Supervised Instance Segmentation using the Bounding Box Tightness Prior. 2019. Advances in Neural Information Processing Systems 32
[8] Lempitsky, Victor; Kohli, Pushmeet; Rother; Carsten and Sharp; Toby. Image Segmentation with A Bounding Box Prior. 2009. IEEE 12th International Conference on Computer Vision
[9] OGC 06-121r9, OGC® Web Services Common Standard (2010), https://portal.opengeospatial.org/files/06-121r9
[10] OGC 06-042, OpenGIS Web Map Service (WMS) Implementation Specification version 1.3.0 (2006), http://portal.opengeospatial.org/files/06-042
[11] Web Map Services — Application Profile for EO Products (0.3.3) (2009), http://portal.opengeospatial.org/files/07-063r1
[12] OGC 12-111r1, OGC Best Practice for using Web Map Services (WMS) with Time-Dependent or Elevation-Dependent Data (1.0) (2014), https://portal.opengeospatial.org/files/12-111r1
[13] OGC 19-008r4, OGC GeoTIFF Standard version 1.1 (2019), http://docs.opengeospatial.org/is/19-008r4/19-008r4.html